A technical, examiner-aligned guide for students in Economics, Psychology, Biology, Business, and World Studies.
Data collection is the backbone of a strong Extended Essay. Examiners consistently reward essays that demonstrate rigorous methodology, clear justification of data sources, and the ability to link evidence to argument. Weak or poorly justified data leads to superficial analysis and lower marks—even if the writing is polished.
Below is a subject-specific guide on how to plan, gather, evaluate, and integrate data, with technical considerations and concrete examples.
1. Start With a Methodology That Fits Your Research Question
A strong EE begins with an RQ that implicitly defines:
- the type of data needed
- the units of analysis
- the variables
- the methodology
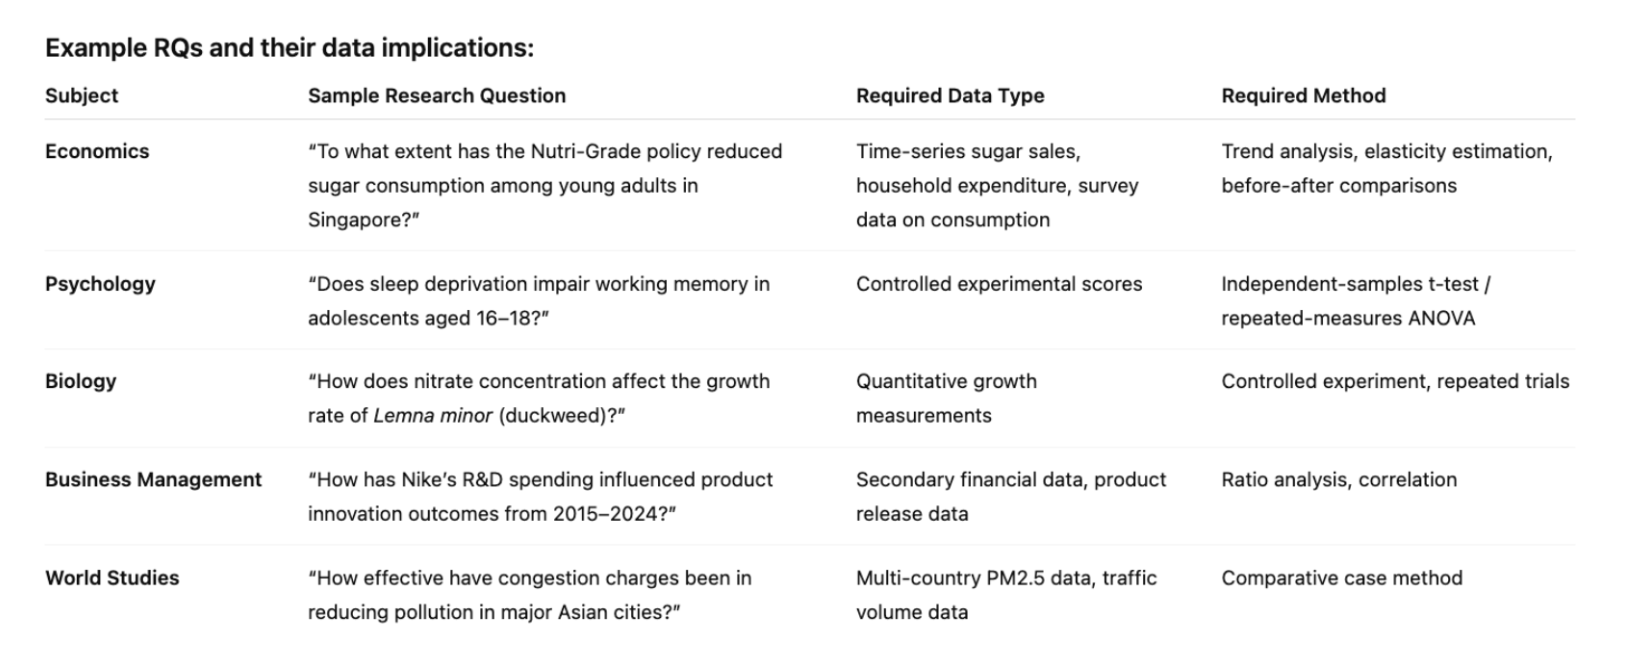
Example RQs and their data implications:
Before collecting anything, the student must explicitly define:
- Independent variable
- Dependent variable
- Measurement instruments
- Data collection window / sampling frame
This forms the foundation of a credible methodology section.
2. Primary vs Secondary Data: When to Use What
A. Primary Data: High Control, High Validity
Particularly relevant for: Psychology, Biology, ESS, some World Studies.
Primary Data Methods:
- Experiments
- Field measurements
- Surveys (with rigorous design)
- Structured observations
- Interviews (with coding schemes)
Example (Psychology):
A working-memory experiment might collect:
- n = 30 participants
- 2 conditions (Sleep-deprived vs control)
- DV = Digit Span score
- Statistical test = Independent t-test
Technical Note:
IB expects validated psychological instruments.
E.g., Digit Span Task, Stroop Test, n-back tasks—not invented questions.
Example (Biology):
For a nitrate concentration experiment:
- IV: Nitrate concentration (0, 5, 10, 20 mg/L)
- DV: Relative Growth Rate (RGR)
- Controlled variables: temperature, light intensity, pH, nutrient composition
- 3–5 replicates per condition
Technical Note:
Data must be quantitative, repeatable, and include raw data tables.
B. Secondary Data: High Reliability, High Breadth
Useful for: Economics, Business, Global Politics, World Studies.
Strong Secondary Data Sources:
- Government databases (DOS, MTI, IMF, World Bank)
- Academic journals (Google Scholar, JSTOR)
- Health datasets (MOH, CDC, WHO)
- Company annual reports
- Market reports (Statista, Euromonitor)
Example (Economics):
For a policy impact question:
- Yearly sugar import volumes
- Retail sugar prices
- Household expenditure survey
- Soda sales data
- Nutri-Grade compliance reports
Possible techniques:
- Price elasticity estimation
- Before–after analysis
- Regression (if appropriate, but must be justified thoroughly)
- Trend decomposition
Technical Note:
IB examiners favour students who justify why each dataset is appropriate and discuss its limitations and biases (e.g., proxy variables).
Example (Business Management):
RQ on whether R&D spending improved product innovation:
- R&D expenditure from annual reports
- Number of product launches
- Innovation awards
- Revenue breakdown by category
- Patent filings
Possible analyses:
- Correlation analysis
- R&D intensity ratios
- Trend analysis
- Gross margin changes associated with new products
3. Technical Criteria for “IB-Quality” Data
The IB implicitly grades data quality based on the following:
A. Validity
Data must measure the specific concept intended.
Example:
Using “Instagram likes” as a proxy for “consumer demand” is invalid for a Business EE.
B. Reliability
Data should be consistent and replicable.
- In Biology → repeated trials
- In Psychology → standardised tests
- In Economics → official statistics
- In Business → audited financial statements
C. Representativeness
Especially important for survey-based EEs.
Example:
A survey of 20 classmates is not representative for consumption patterns of Singapore’s entire youth population.
You must define:
- sample size
- sampling method
- justification of sample demographics
D. Ethics
Required for human studies (Psychology, World Studies, Economics surveys).
- informed consent
- anonymity
- no minors without parental approval
- no deception (Psychology rule)
- minimal risk procedures
The EE must include a brief ethical statement.
4. Data Collection Techniques by Subject
A. Economics
Best datasets:
- time-series macro indicators
- cross-sectional survey data
- price and quantity data
- regulatory or policy documents
- company market share records
Advanced techniques:
- QD–QP trend analysis
- Demand curve approximations
- Calculating PED, XED, or YED
- Interrupted time series (before/after policy)
- Simple regressions (only when justified properly)
Example:
Analysing the impact of ERP rates on vehicle flow using LTA traffic volume data.
B. Psychology
Common designs:
- experimental (most common)
- correlational (with validated instruments)
- quasi-experimental
Data must be numerical and statistically analysable:
- reaction times
- memory scores
- Likert scales (validated only)
Avoid:
- personality quizzes written by the student
- unvalidated “stress tests”
- extremely small sample sizes (e.g., <15)
C. Biology
Data collection must follow scientific rigor:
- replicate each experiment 3–5 times
- record environmental conditions
- present raw data with uncertainties
- calculate means and standard deviations
- use statistical tests (t-test, chi-square, ANOVA where appropriate)
Example:
Measuring chlorophyll concentration using a spectrophotometer and converting absorbance values using the Beer–Lambert law.
D. Business Management
Students rely mostly on secondary data:
- financial ratios
- market share
- growth rates
- innovation indexes
- operational KPIs
Good EEs show multi-angled analysis:
- investor reports
- SWOT but only as evidence-supported
- competitive benchmarking
- cost-benefit interpretation backed by numerical data
E. World Studies
Mixed-method research is common:
- policy analysis
- environmental data
- epidemiological statistics
- interviews with experts
- cross-city comparisons
Example:
Comparing PM2.5 levels pre- and post-congestion charge in Singapore vs London, using WHO Air Quality Database.
5. How Much Data Is “Enough”?
IB examiners prefer:
- Deep analysis of a moderate dataset
over - Superficial analysis of a massive dataset
Rule of thumb:
- 3–5 strong datasets (Economics, Business)
- n ≥ 20 participants (Psychology)
- 3–5 experimental conditions × 3 replicates (Biology)
6. Presenting Your Data Correctly
Technical checklist:
✔ clear units
✔ axis labels and legends
✔ error bars where relevant
✔ raw data tables in the appendix
✔ identification of anomalies
✔ justified statistical tests
✔ integrated commentary (NOT isolated charts)
Conclusion
High-quality data collection transforms the EE from a descriptive essay into a rigorous academic investigation. When students:
- choose the correct methodology,
- justify every dataset,
- demonstrate statistical or economic reasoning, and
- acknowledge ethical and methodological limitations,
they consistently score in the top bands.